
BRIDS Market Pulse
In the Spotlight
Domestic buying supports the rebound despite accelerating foreign selling
The JCI gained 4.9% wow to 5,439.3, recovering from Monday's close of 4,996.6, its lowest since Oct20. The rebound came despite Rp6.67tr (c.US$370mn) of foreign net selling, more than double the Rp3.19tr recorded during the MSCI announcement week, when the index fell 14.9%. We see the recovery as being supported by domestic buying rather than an improvement in foreign flows.
SOE names benefited from several sources of demand, as TLKM accelerated its Rp4tr buyback programme on 20 October, while BBRI announced a second tranche of share buybacks of up to Rp1tr from 22 October to 21 Jan27. Media article quoted Danantara chief that it had begun purchasing listed shares, with a focus on SOEs, though the scale of its purchases has not been disclosed. IDX also announced measures following its meeting with MSCI, including identifying affiliated shareholders in disclosures of ownership above 1% and excluding High Shareholding Concentration (HSC) stocks from the JCI.
BMRI, BBRI, BBNI and TLKM together contributed around half of the JCI's 254.2-point gain, while BBCA fell 2.9% amid the week's largest foreign outflow. The divergence suggests that domestic demand is supporting selected names, but does not yet establish a broader market floor.
Foreign selling remains the central risk under the MSCI scenario
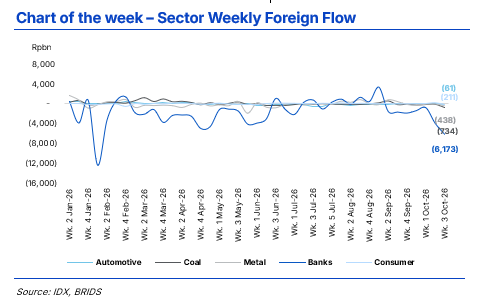
Foreigners have sold around Rp10tr, or US$555mn, since 16 October, including Rp6.67tr this week. The four largest banks accounted for Rp5.79tr, or 87% of the weekly outflow. These flows are consistent with anticipatory foreign repositioning.
Our 21 October Strategy note estimates potential foreign outflows of US$4.3-13.1bn under a Standalone downgrade, with US$7.5bn as the base case, including both active and passive selling. Active-fund behaviour remains the larger uncertainty, while passive flows would be tied more closely to the eventual index decision and implementation. We cut our end-2026 JCI target to 6,000 and introduced an indicative end-2027 target of 7,600. The near-term test remains whether domestic demand and lower valuations can absorb further foreign selling without another leg down.
Pressure is spreading to bonds and domestic yields
The 10Y SBN yield rose from 7.16% on 19 October to around 7.45% by Friday. BI indicated on 23 October that foreign selling since 16 October had extended beyond equities to SBN and SRBI, although the amounts were not disclosed. The 5Y CDS rose to 100.3bps on 22 October from 92.4bps on 14 October. We see the rise in local bond yields as an additional transmission channel from portfolio outflows, rather than clear evidence of a deterioration in sovereign credit fundamentals. The rupiah weakened 0.4% wow to Rp18,050/US$.
At its 20-21 October RDG, BI held the BI Rate at 5.75% and raised the Deposit Facility rate by 25bps to 5.00%. It also announced a phased 2ppt reduction in the reserve requirement for conventional banks from 9% to 7%, with 1ppt cuts effective in Nov and Dec26, alongside stronger DNDF hedging incentives. The policy mix seeks to support the rupiah while releasing liquidity to banks.
At 5,439.3, the JCI trades at around 7.7x our FY27F EPS of 706, implying a 13.0% earnings yield and a spread of around 553bps over the 10Y SBN. This has narrowed from around 646bps on 19 October, partly due to the rise in SBN yields.
Early 3Q26 results are supportive, but funding costs remain a concern
BMRI reported 9M26 net profit of Rp45.5tr (+21% yoy), equivalent to 79% of our FY26F estimate and 80% of consensus. Earnings were supported by non-interest income and cost efficiency, while the bank-only NIM fell 34bps qoq to 3.9% as cost of funds rose 30bps to 2.3%. Management also reported an increase in loans at risk to 6.8%, reflecting restructuring among SOE construction and logistics borrowers, but maintained that associated provisioning remains within guidance.
UNVR's 9M26 net profit excluding Sariwangi rose 10.6% yoy to Rp3.3tr, in line with our estimate. Revenue grew 7.4% yoy in 3Q26, supported by 6.4% volume growth, although its gross margin eased to 45.1% on higher input costs.
We believe these results could provide some earnings support, though the market remains sensitive to foreign flows and the risk of higher funding and commodity costs.
Market and Sector Performance
The JCI gained 254.2 points, or 4.9% wow, to 5,439.3, following four consecutive positive sessions after Monday's 3.6% decline. It recovered around 28% of the previous week's 908.7-point fall and remains down 37.1% YTD. The rupiah ended at Rp18,050/US$, down 0.4% wow.
Indonesia outperformed the regional markets we track, while Hong Kong (-4.5%), Japan (-4.0%), Taiwan (-2.3%) and Korea (-2.1%) lagged amid continued technology-related selling. All IDX sectors rose, led by Transportation and Logistics (+9.0%), Energy (+6.4%), Infrastructure (+5.7%), Property (+5.4%) and Financials (+5.0%). Technology was broadly flat, with DCII's decline offsetting gains elsewhere.
BMRI (+40.9 points), BBRI (+40.0), TLKM (+31.5), BREN (+20.5) and BBNI (+14.9) were the five largest contributors, together accounting for 58% of the index gain. The principal detractors were BBCA (-13.7 points), MORA (-11.7), DCII (-7.4), BYAN (-6.6), MDKA (-6.5) and BRMS (-6.0).
Across BRIDS coverage, Infrastructure (+26.1%), Industrial Estate (+21.4%), Utility (+15.3%), Coal and Conglomerates (both +13.3%), Oil and Gas (+13.2%) and Telco (+12.9%) led. Banks gained 6.2%, or 11.6% excluding BBCA. Tower (-0.3%) and Consumer (-0.8%) were the only coverage sectors to decline. Coal's rebound came despite foreign selling of Rp733bn across AADI, PTBA, ADRO and ITMG, while metal performance diverged, with nickel names recovering and gold-related names weakening alongside the gold price.
Our Strategy stock selections gained 7.0% on an equal-weighted basis, compared with 4.9% for the JCI. Group 1 non-MSCI names rose 6.6%, while Group 2 MSCI constituents rose 7.4%, led by BBNI and AADI. While encouraging, one week's relative performance is not sufficient to conclude that selling pressure has ended.
Equity Foreign Funds Flow
Foreign investors recorded net selling of Rp6.67tr across all markets, versus Rp3.19tr in the preceding week, bringing YTD selling to Rp94.87tr, or approximately US$5.43bn. Net selling in the regular market was larger, with negotiated-market purchases providing a partial offset.
The four largest banks accounted for most of the selling: BBCA (-Rp2.95tr), BBRI (-Rp2.17tr), BMRI (-Rp508bn) and BBNI (-Rp162bn). Other notable outflows included TLKM (-Rp566bn), BRIS (-Rp315bn), AADI (-Rp265bn), PTBA (-Rp255bn), TINS (-Rp194bn) and ANTM (-Rp163bn). Inflows were relatively modest, led by AMMN (+Rp95bn), DMAS (+Rp85bn), TPIA (+Rp62bn), ENRG (+Rp59bn) and MAPA (+Rp57bn).
Foreign selling remained concentrated in liquid bank shares even as their prices recovered, suggesting that the rebound offered an opportunity for some investors to reduce exposure. Regionally, Indonesia's US$370mn outflow was the third largest after Taiwan (-US$7.58bn) and Korea (-US$1.04bn). India (+US$148mn) and Thailand (+US$98mn) recorded inflows.
Bonds, Rupiah and Macro
The 10Y SBN yield increased to around 7.45% by 23 October, from 7.16% on 19 October, while the 5Y yield was 7.19% on 22 October. Foreign holdings of tradable SBN stood at Rp921.96tr on 16 October and around Rp920tr on 19 October. BI subsequently confirmed foreign outflows from SBN and SRBI, but the size remains unquantified. The 5Y CDS rose to 100.3bps from 92.4bps on 14 October.
BI maintained the BI Rate at 5.75% and the Lending Facility rate at 6.50%, while raising the Deposit Facility rate to 5.00%. It will reduce the conventional-bank reserve requirement to 8% in November and 7% in December, from 9% currently, with corresponding reductions for sharia banks. The KLM ceiling will also fall to 5% from 6% in December. DNDF premium reductions for foreign-funding hedges were increased to 40% for six-month tenors and 45% for twelve-month tenors.
War Watch
Middle East developments continued to support the oil risk premium. Houthi attacks on Saudi targets, including energy-related infrastructure, intensified during the week, while incidents involving tankers in and around the Strait of Hormuz persisted. Reports of possible further US military action have added to uncertainty ahead of the 3 November US midterm elections.
We see the immediate risks as potential disruption to Saudi production and exports, as well as the cost of moving oil through the region.
Commodities Price
Thermal coal was broadly stable. ICI-3 increased to US$100.0/t from US$99.1/t, while ICI-4 eased to US$78.2/t from US$78.9/t. Newcastle futures edged up to US$150.9/t from US$150.0/t. Chinese port inventories were little changed at 2,038.3.
Base metals were mixed. LME copper fell to a five-week intraday low of US$14,031/t on 22 October as inventories increased to around 273kt. Friday morning indications were US$14,190/t for three-month copper, US$15,825/t for nickel and US$50,715/t for tin. SMM's Indonesian NPI FOB index stood at US$136.4 per nickel unit, while MHP was US$13,561/t, above its October average of US$13,238/t.
Brent settled at US$116.72/bbl on Friday, up around 6% wow, its highest settlement since 29 April. The rise was supported by renewed concerns over Saudi energy infrastructure and shipping security near Hormuz.
The delivered cost of oil remains considerably higher than the Brent benchmark. By mid-October, indicative VLCC freight to China was around US$28/bbl from Yanbu, US$33/bbl from the Gulf at end-September and US$34-36/bbl from West Africa and Brazil. War-risk insurance and delays add further costs, with estimates suggesting crude landed in China cost around US$140/bbl in mid-October. These figures vary by route, loading point and risk exposure, and should not be read as a single uniform premium.
Some freight rates have since moderated. Gulf of Oman-to-China VLCC rates eased to around US$657k/day, equivalent to US$15.6/bbl, from US$913k/day two weeks earlier, while reported Hormuz flows recovered to around 11.7mbpd in October. We believe the week's rise in Brent therefore reflected renewed concerns about production and export disruption, even as freight conditions improved at the margin.
Precious metals weakened. Spot gold fell almost 4% wow to around US$3,996/oz amid higher-for-longer rate expectations, while silver eased to around US$53.90/oz.
Weeks Ahead: Key Catalysts
- FOMC, 27-28 October: the policy announcement is scheduled for Thursday, 29 October at 01:00 WIB. Markets are pricing a hold in October while a December hike remains a risk.
- US September PCE inflation, 29 October: another key input for the Fed outlook.
- US weekly oil inventories, 28 October, and further Middle East developments, including any US military response.
- Indonesia 3Q26 results: remaining large-bank releases, with particular focus on cost of funds and asset quality.
- Further ahead: Indonesia October CPI and PMI (2 November), US midterm elections (3 November), Indonesia 3Q26 GDP (5 November), MSCI November Index Review (11 November).
BRIDS Key Research Reports
Equity Strategy, MSCI Downgrade Risk: Foreign Flows Test the Valuation Floor (21 October)
We lowered our end-2026 JCI target to 6,000 from 7,200, equivalent to 8.5x FY27F EPS of 706, and set an indicative end-2027 target of 7,600, or 10.0x FY28F EPS of 759. The central risk is further foreign selling ahead of a potential reclassification to Standalone status, with the uncertainty more pronounced for active funds than identifiable passive mandates.
Our bottom-up analysis estimates US$2.5-6.0bn of potential passive outflows, including US$1.9bn of identifiable index-related exposure. Together with assumed active selling, potential outflows reach US$4.3-13.1bn, with US$7.5bn as our base case. Every 1ppt increase in domestic institutional equity allocation could provide around US$1.1bn of incremental demand, implying that fully offsetting the base case would require an increase of around 7ppt. We believe this is more likely to be gradual than immediate.
We favour names with relatively lower exposure to foreign selling. Group 1, outside MSCI, comprises AMMN, BTPS, DEWA, ELSA, GOTO, ISAT, MIDI, MIKA and TINS. Group 2, selected MSCI constituents, comprises AADI, ADRO, ASII, BBNI, BRMS and INDF. The note places greater emphasis on the ability of domestic demand and attractive valuations to absorb outflows than on a specific market bottom.
Bringing the fleet in-house is driving earnings. 3Q26 revenue rose 14% q-q (+23% y-y) to Rp1,896bn. EBITDA margin rose to 32.8% from 29.8% in 2Q26 and core profit to Rp156bn (+155% q-q, +158% y-y).
- Drivers: Bengalon’s fleet internalization contributed for the full quarter, weather was favourable and all material movement was in-house. Subcontracted overburden fell to zero from 4.0mbcm in 2Q26.
- 9M26: EBITDA of Rp1,558bn is 72% of our FY26F. Overburden of 113.0mbcm (+12% y-y) is 78.6% of FY26F and coal of 13.1Mt is 77.8%.
- Financing costs: interest expense of Rp112bn in the quarter limited the conversion of EBITDA into net profit.
FY27F. Our base case has overburden rising 61.5% y-y to 231mbcm:
- Existing operations: 136mbcm.
- Sebuku: 25mbcm, against management’s 30–35mbcm target. Sebuku started in August 2026.
- Additional scope: 70mbcm. This accounts for nearly 80% of the increase, so FY27F growth depends more on expanded mining scope than on Sebuku.
Tender upside. The pipeline includes coal tenders in South Sumatra and a nickel opportunity in East Halmahera.
- If both are won: FY27F net profit would be Rp2.54tr, against Rp1.64tr in our base case, and the implied TP would be Rp570.
- Caveat: the implied c.44% incremental EBITDA margin in that scenario needs scrutiny, and the outcome depends on tender awards, mobilisation and financing.
Funding. DEWA plans a Sukuk Wakalah of up to Rp3.5tr. The first tranche of up to Rp1.5tr is targeted for December 2026 and would cover about 46% of FY27F capex of Rp3.27tr.
Regulation. Management expects limited disruption from Kepmen ESDM No. 365/2026, which favours local contractors. It cites KPC’s and Arutmin’s coal downstreaming roles under the PSN framework.
Valuation and risks. DEWA trades at 6.4x FY27F P/E. Our FY27F EPS is 36.4% above consensus. Risks are execution delays, higher capex, rising financing costs and how the regulation is implemented. DEWA is one of our Group 1 Strategy picks.
Our site visit to NeutraDC Batam and Telin’s cable landing station confirms that demand is there. The binding constraints are power and water.
NeutraDC Batam. NeutraDC has re-scoped Batam to 118MW of AI-ready capacity, merging the original plan of three 18MW campuses into two sites:
- BTM-1 (18MW): fully contracted by Gorilla Technology. The first 6MW is ready for service in 4Q26 and the full 18MW in 1H27.
- BTM-2 (100MW): direct liquid cooling with rack densities of 83–250kW, targeting readiness for service in FY28.
Batam constraints. Batam’s committed and early-stage data-centre pipeline of about 1.4GW is well beyond local supply:
- Power: installed generation is about 1GW, and PLN Batam targets 1.2–1.3GW. Operators must now build their own power plants, at about Rp25bn/MW.
- Water: the pipeline would absorb about 92% of remaining public water headroom, so operators must build seawater desalination plants.
BTM-2 capex. NeutraDC has secured 90MW of PLN power against the 165MW it needs for 118MW. Self-building the 75MW gap adds about Rp1.9tr (US$1.1mn/MW of IT load), on top of management’s US$7–9mn/MW guidance. We estimate total BTM-2 capex at US$0.8–1.0bn.
- Funding: proceeds from the ongoing NeutraDC divestment and new loans. TLKM’s net debt is 0.6x EBITDA.
Telin. Telin’s own cables are over 85% sold: IGG-SEA-US is 99% utilised, SJC2 92% and BSCS 81%. Bifrost is expected to sell out by 1Q27.
- Targets: FY26 EBITDA guidance of Rp2tr and an enterprise value of Rp40–45tr by FY30.
- Capex: Rp32tr through FY31.
Capex and valuation. Telin’s plan implies group capex rising to about Rp35tr from our FY27F assumption of Rp29tr, before BTM-2. That puts near-term free cash flow under pressure, but the shift toward data-centre and subsea assets improves visibility on long-term growth.
- Valuation: 3x FY26F EV/EBITDA against a 5-year average of 5.1x, with an 8.4% FY26F dividend yield.
- Key risk: under-investment in 5G.
Sector forecasts. We expect 3Q26 revenue growth of 14.7% y-y (+2.9% q-q), taking 9M26 growth to 16.0%, in line with our FY26F.
- Margins: IDR volatility and promotions narrow gross margin by 20bps q-q and EBIT margin by 30bps q-q.
- Core profit: 9M26F growth of 14.2% y-y, 68.3% of our FY26F.
Same-store sales. SSSG is improving gradually. MIDI’s 3Q26 SSSG accelerates to 6.1% from 3.4% in 2Q26, and Eid restocking in December 2026 supports momentum into 4Q26.
By company:
- MIDI: 3Q26F revenue +14.6% y-y.
- MAPA: revenue +8.6% y-y, with gross margin down 80bps q-q to 45.7% on FX-related costs.
- MAPI: revenue +15.3% y-y.
- ACES: revenue +11.9% y-y, with ASP hikes limiting gross margin erosion to 30bps q-q.
Flows. Foreign ownership across our coverage has fallen since the start of FY26, but every retailer recorded net foreign inflows in October MTD (Rp4–34bn).
Valuation. The sector trades at 8.9x FY26F P/E, about 1.4SD below its 3-year mean. MIDI is also one of our Group 1 Strategy picks.